Live Line Chart
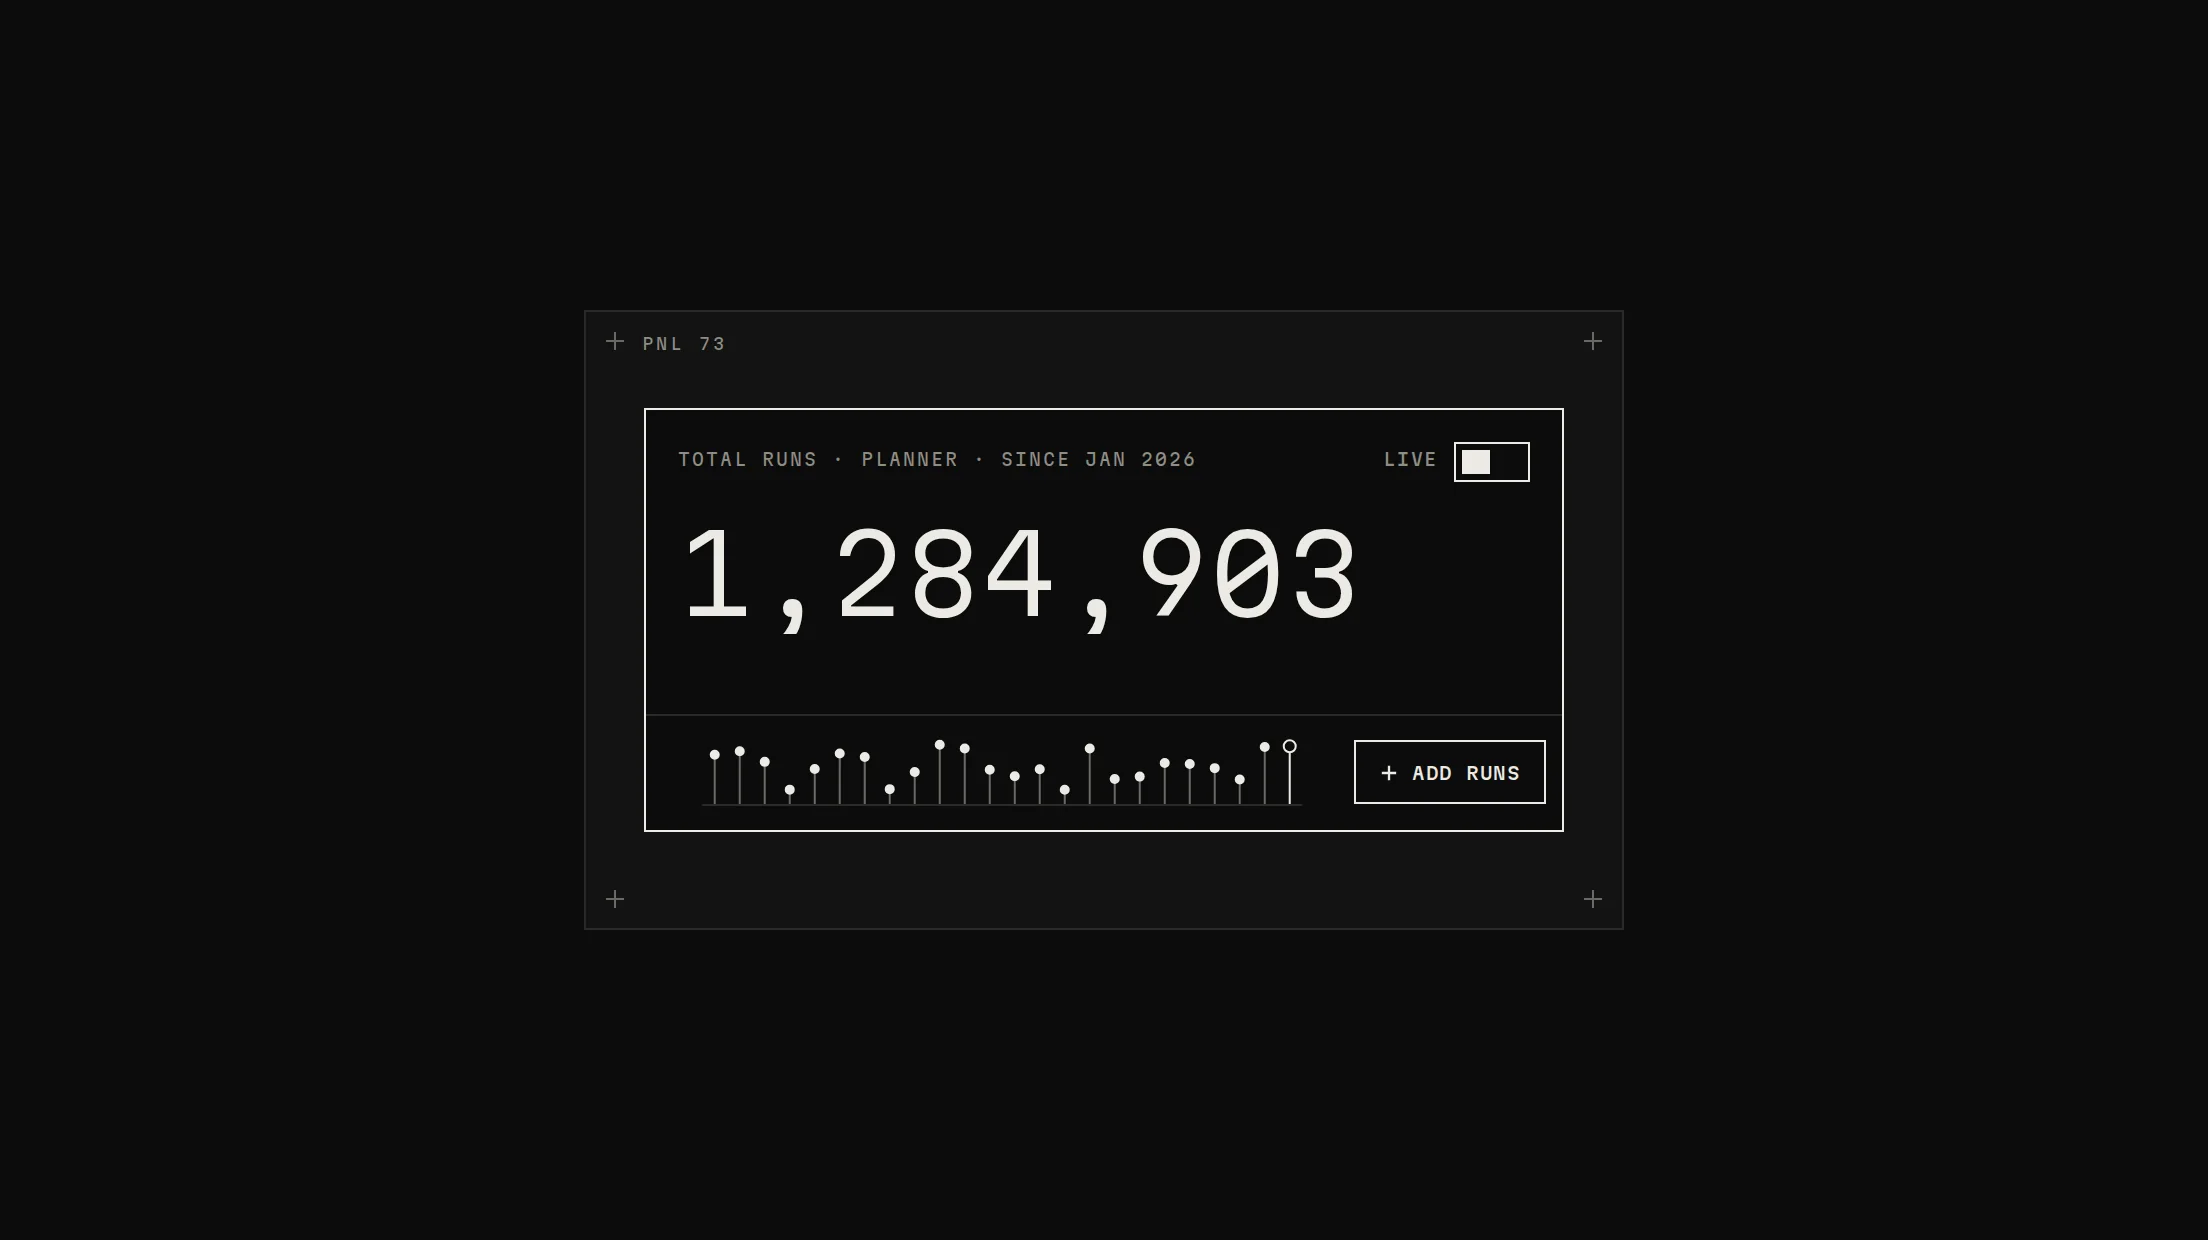
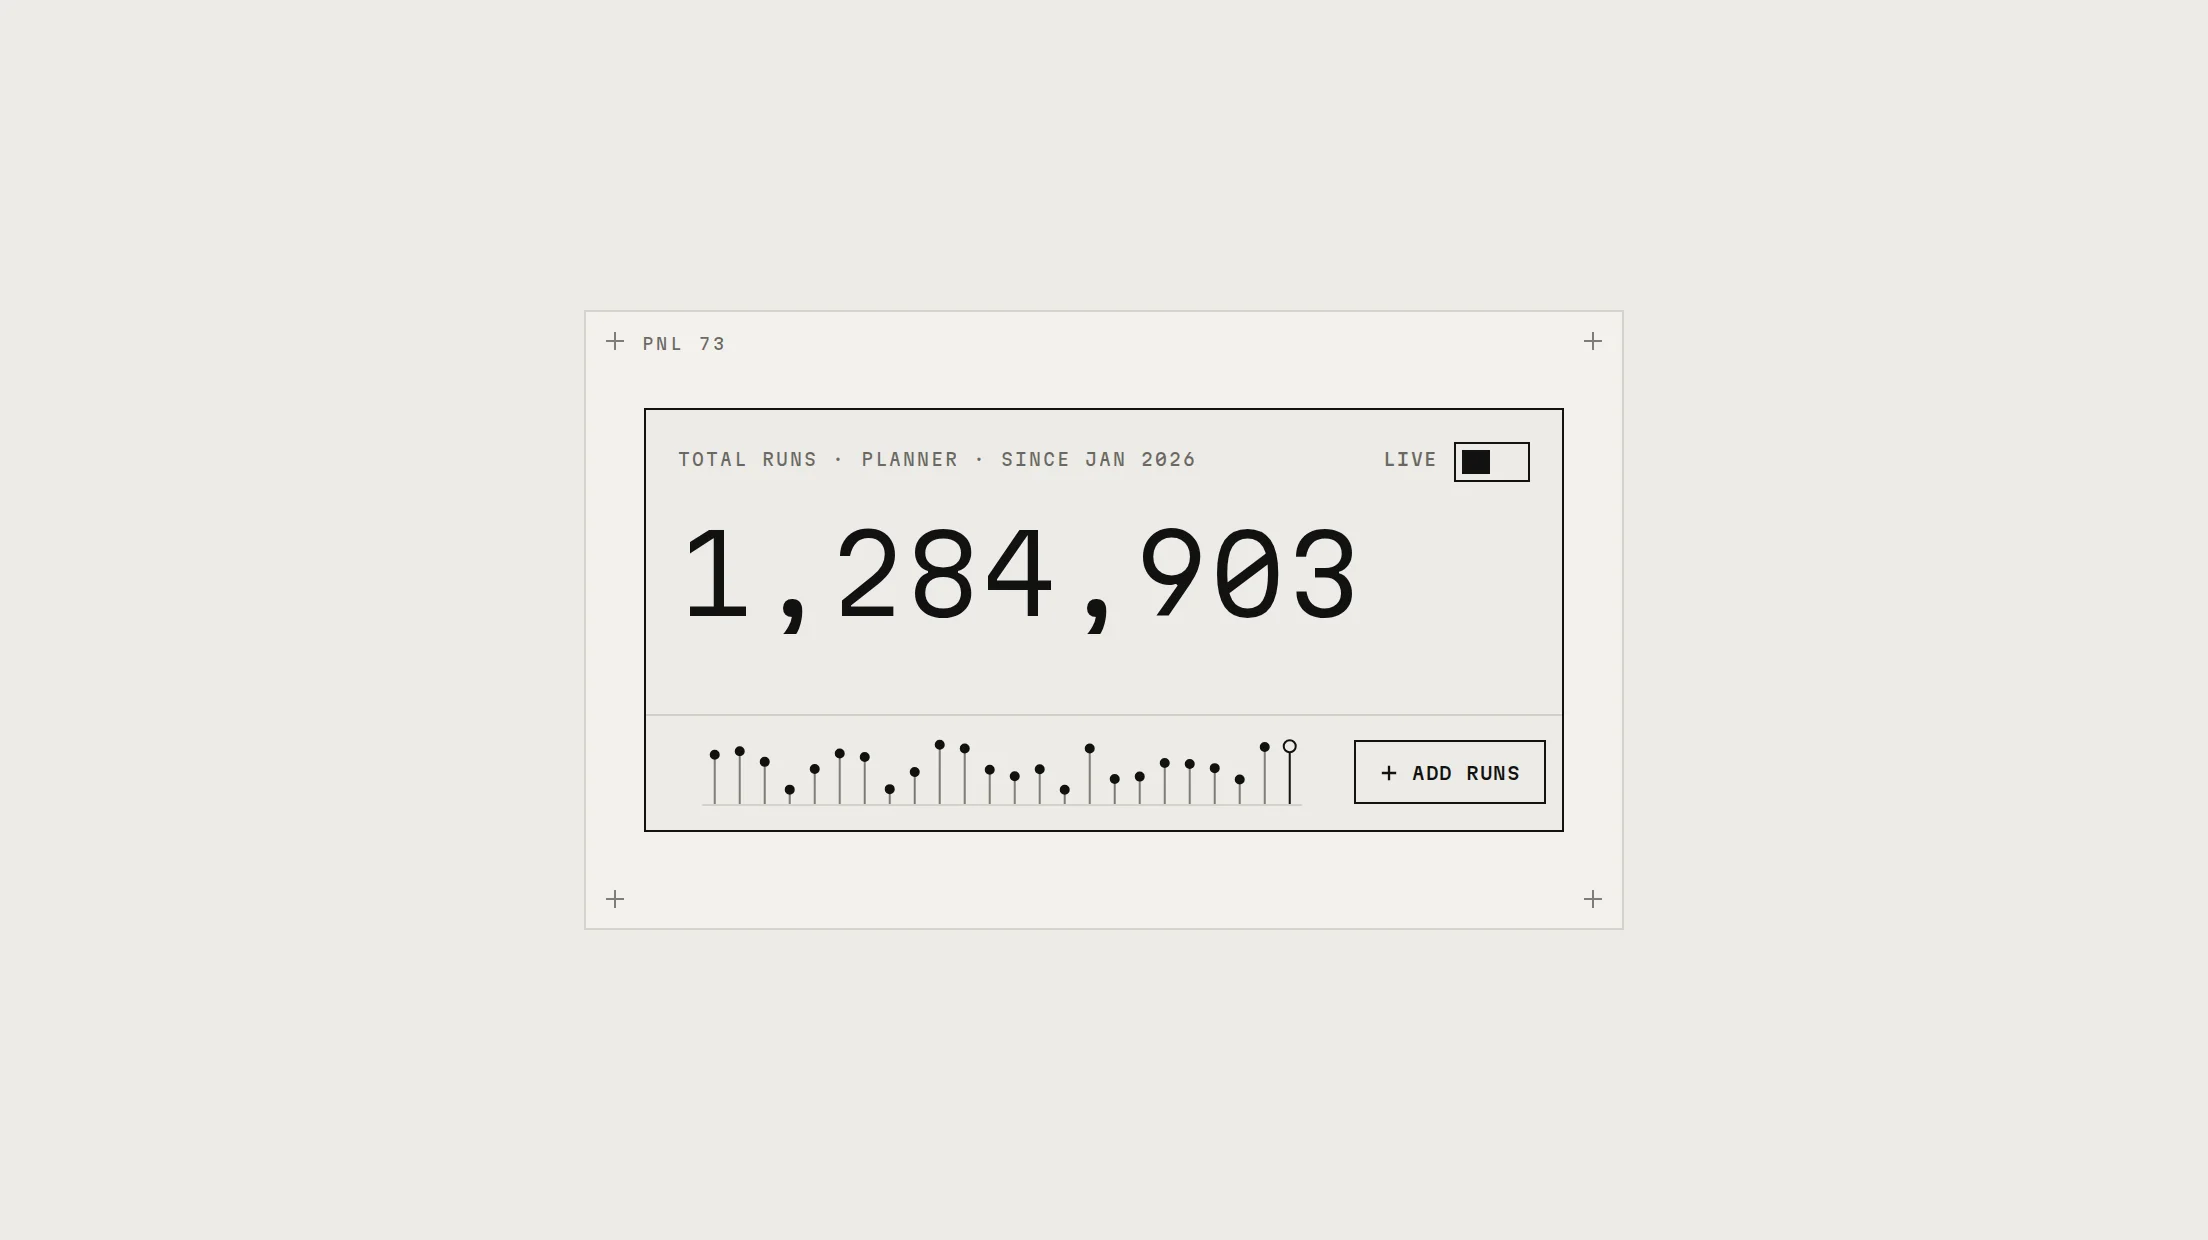
Prov1.0.0A line chart that scrolls as live samples arrive, with a threshold line.
Build for your project
Code/install build
Usage
Import it and pass your content. The props that matter most are listed next.
Example
"use client";

import * as React from "react";
import { LiveLineChart } from "@/components/ui/notchset/live-line-chart";

/** Push one sample a second and drop the oldest; the chart scrolls on each change. */
export function LatencyStream({ sample }: { sample: () => number }) {
  const [buffer, setBuffer] = React.useState(() => Array.from({ length: 61 }, () => 150));
  React.useEffect(() => {
    const iv = setInterval(() => setBuffer((b) => [...b.slice(1), sample()]), 1000);
    return () => clearInterval(iv);
  }, [sample]);
  return <LiveLineChart data={buffer} threshold={{ value: 400, label: "SLO 400MS" }} />;
}
Props
data–number[]Oldest first; push one and drop one per tick.
live–booleanScroll on new data.
threshold–{ value, label }The dashed signal rule.
spikeAt / yMax / ticks / xLabels–number / number[] / string[]Scale and spikes.
Anatomy
- Hand-built SVG, no chart library.
- No primitive needed: one file serves both builds.
- Uses the notchset-scroll-a / -b keyframes in the foundation.
LiveLineChartdata-slot="live-line-chart"The chart.
findSpikesdata-slot="—"Spike indexes, for a header count.
Source
components/ui/notchset/live-line-chart.tsx
This component is included with Pro.
Try the live preview above. Get Pro to install the source.
Build for your project
Code/install build
Installation
pnpm dlx shadcn@latest add @beautiful-ui-pro/live-line-chartNeeds your registry key. Your components.json style picks the Base UI or Radix build: radix-*, new-york and default get Radix, base-* gets Base UI.
Styles didn't apply?
The CLI adds the styles to the CSS file named in components.json (tailwind.css). Check that it points at your global stylesheet, that the project uses Tailwind CSS v4, and that the file is imported in your root layout. Installed by hand: paste styles.css into that file.
For coding agents
Give your coding assistant the Markdown guide instead of screenshots.
Use it for
- A live metric updated about once a second
Use something else when
- History you can page through: use Brush Chart
Mistakes to avoid
- Update at most once a second
Agents find it by
- realtime, live, streaming, latency, monitoring, SLO, Notchset
Where agents read it
- Guide for this component: https://beautiful-ui.dev/md/live-line-chart.md
- Every component, for tools without MCP: /llms.txt
- MCP server:
https://beautiful-ui.dev/api/mcp(setup)
Behaviour
Keyboard
- Tab
- Moves past the chart (no stops inside)
Accessibility
- The SVG is labelled with the latest value and spike count
Motion
- Tick
- The line scrolls one sample over 1000ms linear, alternating two keyframes
- Head
- The dot eases to the newest value (600ms)
Responsive
- Fills its width (viewBox 840 × 180).
Performance
- One path; no reflow per tick.
Changelog
v1.0.0 · 2026-10-02
First release
Part of
Included with Pro
Pro is in early access.